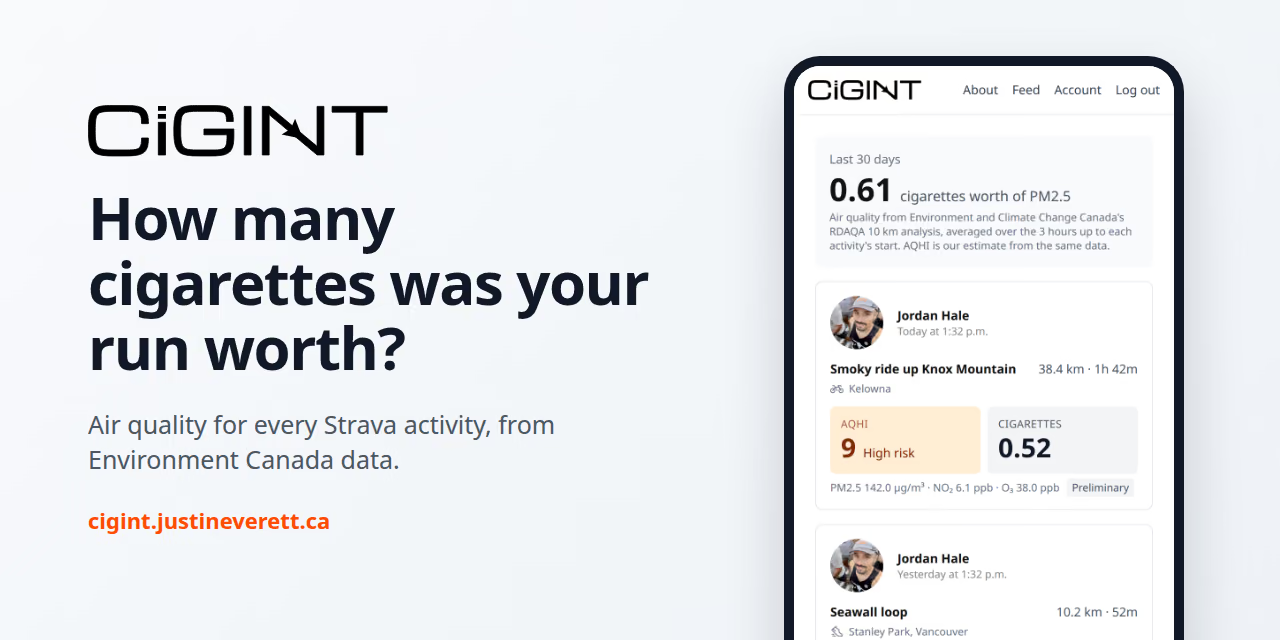
Air quality apps tell you what the air is like right now. I wanted to know what it was like during the activity I’d already finished, at the place I’d actually been, and I wanted the answer in a unit anyone would understand. So I built CIGINT.
Connect your Strava account and every outdoor activity from the last month gets an Air Quality Health Index reading and a cigarette equivalent, using Berkeley Earth’s rule of thumb that a day of breathing 22 µg/m³ of fine particulate is roughly one cigarette.
Why I built it
Most of my work is for clients, where the brief and the stack are set before I arrive. CIGINT was a chance to own every decision end to end: the data model, the auth, the data pipeline, the UI and the deployment. It was also an excuse to work with real scientific data rather than a tidy API.
What I built
- Strava sign-in, written from scratch. I skipped the auth libraries and wrote the OAuth flow myself, with a CSRF check and database-backed sessions. Users, provider accounts and sessions live in separate tables, so adding another login method later means a new row, not new columns.
- An air quality pipeline built on raw model output. Environment and Climate Change Canada publishes its hourly 10 km air quality analysis as GRIB2 grid files. The app downloads and decodes them on the server, finds the nearest grid point to where you started, and averages the three hours before you set off.
- A feed that never waits on its slowest piece. Stored activities render straight away. The Strava sync, the air quality lookups and the place names each stream in on their own as they resolve.
- Care for shared limits. Strava’s rate limits are shared by every user, so the app syncs at most every 15 minutes and looks back 48 hours to catch late uploads.
- Readings that improve on their own. A preliminary reading appears within the hour, and the final analysis replaces it about two hours later.
- A clean exit. Disconnecting revokes access on Strava and deletes everything the app stored about you.
Checking my work
I didn’t want to ship a number I couldn’t stand behind. I compared the app’s AQHI against Environment Canada’s official station readings across 216 station-hours in British Columbia during two smoke events. On average it landed within 0.29 of the official value, and it put the reading in the same risk band 97% of the time.
It’s still an estimate, and the site says so. It reads the air at your starting point rather than along your route, and it doesn’t yet account for how hard you were breathing.
Stack
Next.js 16 with React Server Components and streaming, React 19, TypeScript, Tailwind CSS 4, PostgreSQL with Prisma 8, Vitest, GitHub Actions and Vercel. Every push runs lint, type checks, tests and a production build.
What’s next
Next on my list is estimating breathing rate from heart rate for a dose-weighted number. I also plan to archive the hourly air quality data, so older activities keep their readings after the 30-day window closes.